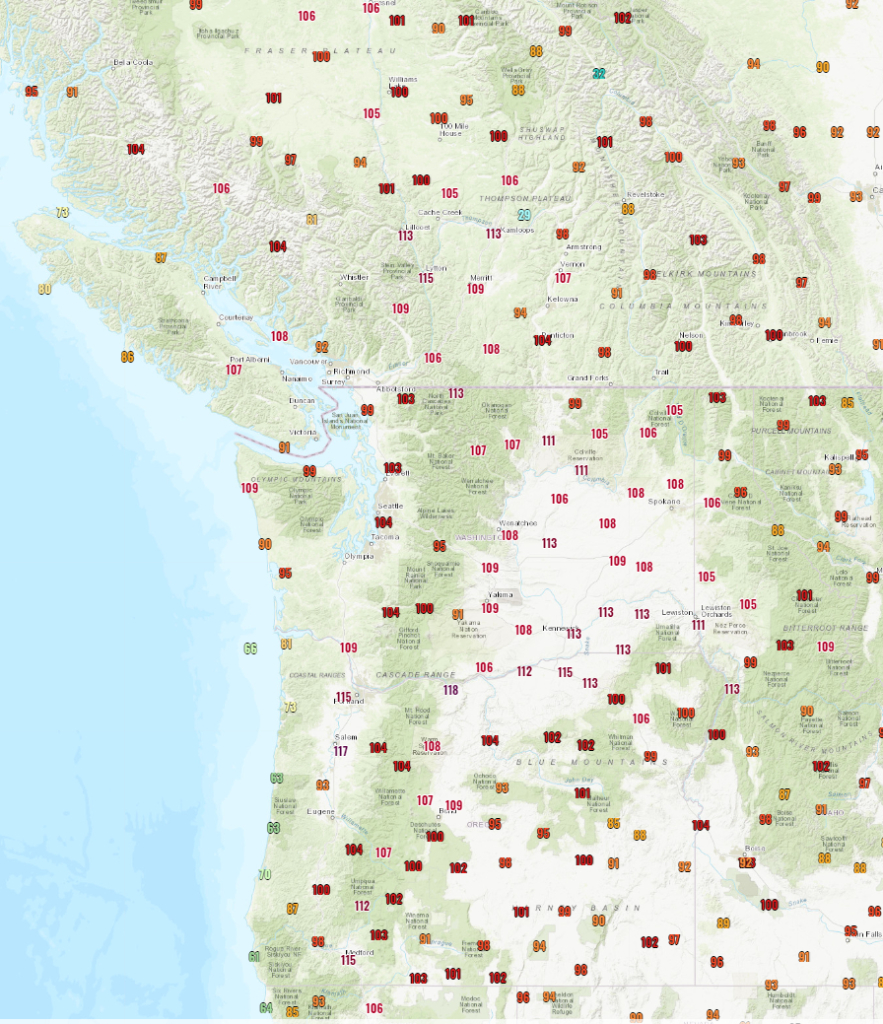
“Unprecedented” is an overused meteorological buzzword, but in the case of the June 2021 Pacific Northwest Heatwave, it is absolutely warranted. This heatwave shattered meteorologist’s preconceptions of what the upper-limit to temperatures is in the Willamette Valley and Pacific NW as a whole. The map of high temperatures recorded on Monday 6/28 defies superlatives.

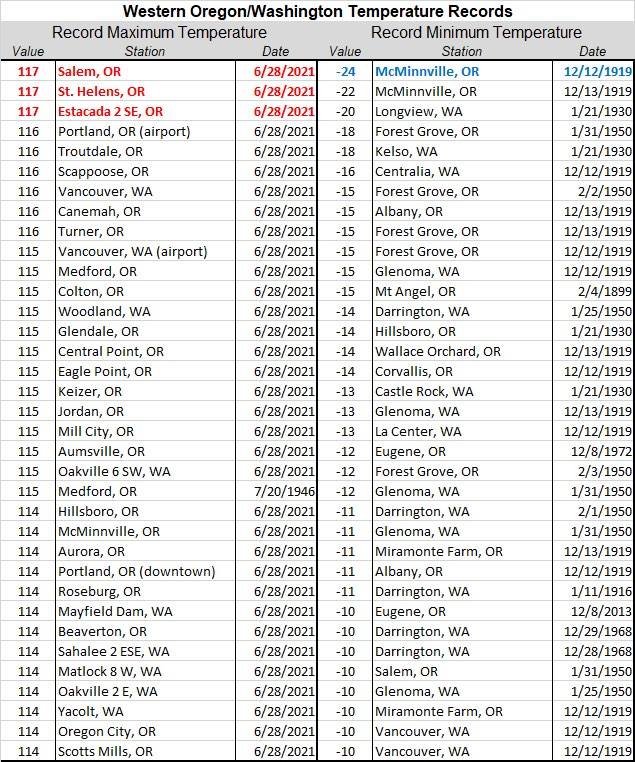
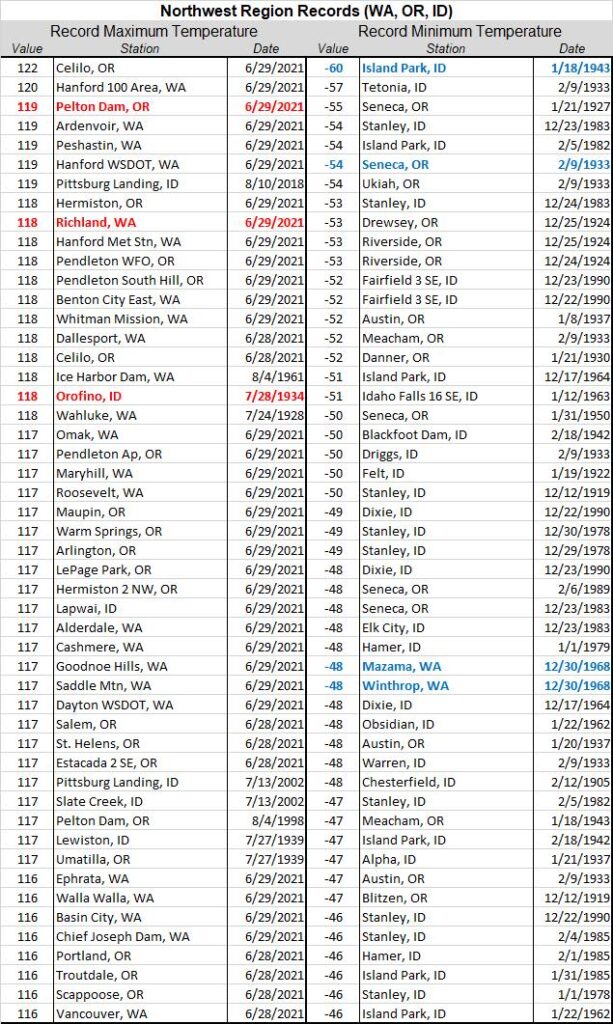
My friend and fellow Portland meteorologist Chris Callais compiled a list of high and low temp records for the Pacific NW. Every ASOS station from the Central Oregon coast north to Cape Flattery, from Medford to Bellingham, and from Central Oregon through all of Central and Eastern Washington recorded all-time record high temperatures from this event. Compare the variability in dates for record minimums vs. record maximums… record minimums are spread throughout many events, while nearly all record maximums for the Pacific NW occurred on 6/28 and 6/29.


I escaped up to Whidbey Island in Puget Sound to avoid the worst of the heat wave but took the train back to Portland on Monday. The train needed to limit its speed to 40 mph due to safety concerns from the rails warping from the extreme heat, and the train couldn’t cross the bridge over the Willamette River due to safety/engineering concerns from the heat. I ended up getting off in Vancouver and taking a Lyft back to my apartment in NE Portland, and I was amazed (but not surprised) by how hot my apartment was when I got back. The water was hot when I would turn on the tap, and even if I ran it long enough for it to cool, it would become very warm within 30 minutes as it absorbed all the heat in the metal faucets/plumbing.
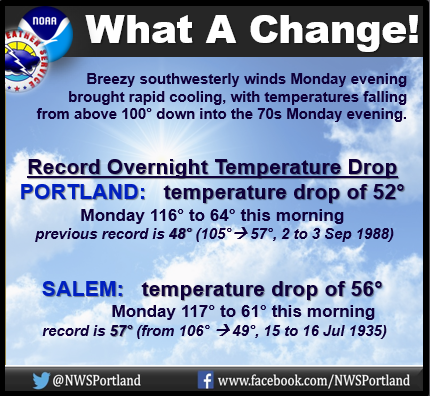
The heat mercifully ended for Western Washington and Oregon Monday night as a record-strong marine push made its way through the Willamette Valley. Many places across the Willamette Valley, including Portland, saw their largest overnight temperature drops on record.
Intense #marinepush now moving through Columbia River Gorge and the Willamette Valley. Portland should see strong marine flow beginning 7-8pm and temps should be in low 70s by 11pm. That’s a 40 degree drop in 4 hours! #heatdome #pnwheatwave2021 #relief pic.twitter.com/WV0VmCvNPv
— Charlie Phillips (@GeoduckChuck) June 29, 2021
Causes:
I won’t delve into the climate change aspect of this event on this blog, but a rapid study put together by a panel of scientists called these temperatures “virtually impossible without climate change” and estimated it as a 1:1000 year event in today’s climate, where mean global temperatures have risen 1.2C (2.2F) since the beginning of the industrial revolution. They also estimated that it could be a 1:5 or 1:10 year event with 2C (3.6F) of additional warming. The MIT Technology Review published a great summary here, and the full study is here. For the record, there is no question in my mind that climate change played a critical role in allowing temperatures to reach the extraordinary levels they did.
Cause #1: Strength of Ridge and Offshore Flow
Regarding the short-term weather patterns, the primary cause of the extreme heat was the strength of a ridge of high pressure overhead and the length of time it stalled over the Pacific NW. Ridges of high pressure are associated with convergence aloft, which subsequently causes air to sink. As air sinks, it warms at a predictable rate, known as the dry adiabatic lapse rate (DALR), of around 9.8 degrees C per km. As this ridge sat over the Pacific NW, the sinking motion persisted and warmed the lower troposphere to unbelievably high temperatures. The 00Z (5pm) sounding at Salem shows how the atmosphere was dry adiabatic all the way from 650 mb to the surface, with the exception of a small surface inversion due to a marine push in the afternoon.

Salem also set an all-time record for temperatures at 850mb on their 00Z 6/29 (5pm PDT 6/28) weather balloon sounding, with a temperature of approximately 30.40 C. The previous record of 28.3C was set on the September 3 00Z 1988 sounding. Not surprisingly, Portland hit a blistering 105 degrees on 9/2… very impressive for September. Additionally, September 2-3, 1988 used to hold the record for the largest overnight temperature drop at Portland before the June 28-29, 2021 marine push and is referenced in the NWS graphic above.
The diagram I created below shows a simplified vertical picture of the “heat dome” responsible for our record-breaking temperatures. Air sinks under a ridge of high pressure aloft and warms at the dry adiabatic lapse rate as it does so. The stronger the ridge, the stronger the sinking motion, so there is a positive feedback here where strong sinking motion strengthens the ridge/heat dome, resulting in even more sinking. If the ridge stays over an area for a long period of time, this feedback can become very intense, and that’s what happened during the June 2021 Pacific NW heat wave.

Near the surface, there is an area of locally lower pressure, called a “thermally-induced trough,” that is created as a result of the extreme heat. This was present over Western WA/OR and helped strengthen offshore gradients, resulting in warming/drying downslope winds off the Cascades.
The images below show the location of the heat dome on Monday afternoon and the “backwards trajectory” of an air parcel 397 meters above sea level at Portland on 12 UTC (5am) Monday 6/28. Note how the air goes up and over the ridge in a clockwise fashion (air circulates clockwise around ridges and counterclockwise around troughs/low pressure systems in the northern hemisphere) and sinks dramatically as it travels from east-to-west along the Washington/Oregon border. The small upper-level trough (not a thermal trough) off the Oregon/California border also helped increase offshore gradients.

Credit: University of Washington

The image below shows a very pronounced surface-based, thermally-induced trough extending from the Oregon/California border up into British Columbia. This trough created offshore gradients and strong, dry, hot offshore flow, giving very high fire danger to Western Washington/Oregon/British Columbia, and it further warmed the surface by driving downslope winds off the Cascades and BC Coast Range.

Credit: University of Washington
Lytton, BC, which is extremely exposed to downslope, easterly flow and commonly experiences extreme warmth, broke Canada’s national record three consecutive days – 116 on Sunday 6/27, 118 on Monday 6/28, and an incredible 121 on Tuesday 6/29. Tragically, on Wednesday 6/30, a quick-moving wildfire destroyed around 90% of Lytton.
Lytton’s Main Street, before and after yesterday’s devastating fire.
(Photo from a Chilliwack Fire Department member) pic.twitter.com/OaoRvg1ch3
— Justin McElroy (@j_mcelroy) July 1, 2021
This sinking air under the ridge completely inhibited cloud formation of any kind. You’ll note that there are indeed some low stratus/fog off the Washington/Oregon coast, but these are to the west of the ridge and not convective clouds – instead, they are formed when cool ocean waters help cool the ambient air temperature to saturation.

Credit: CIRA/RAMMB
Cause #2: Drought and Low Soil Moisture
Another reason for this record-breaking heat is the severe drought over the Western US. After the driest spring on record, soil moistures were near record-low levels, particularly over the Willamette Valley and Inland NW.
Due to the record-dry spring/June heat wave, soil moisture across the Pacific NW is near record lows for this time of the year. Most of the Willamette Valley and Interior NW is below the 3rd percentile. Western WA is better shape due to heavier rain in Mid June. #wawx #orwx pic.twitter.com/08KhnM9Iy6
— Charlie Phillips (@GeoduckChuck) July 7, 2021
When soils are dry, all incoming heat energy goes towards raising the ambient temperature instead of evaporating water. In this way, a drought is somewhat self-reinforcing – the low soil moisture means that all other things equal, the weather will be hotter with lower humidity than if there was higher soil moisture. The extreme drought across the Western US is one of the reasons why the Climate Prediction Center is so confident in forecasting a hotter-than-average summer over the Western US this year.
Additionally, the longer the “heat dome” stayed overhead, the drier the soils became and the easier it was to heat the atmosphere – yet another positive feedback associated with this “heat dome” pattern.
Cause #3: Timing Near Summer Solstice
A third major contributor to the intensity of this heat wave was how it occurred near the summer solstice, when the Pacific Northwest is experiencing its longest days, highest sun angles, and greatest solar radiation (both instantaneous and summed over the course of a day). This also contributed to the extremely warm overnight lows and number of hours spent above 110 degrees… Portland spent 5 hours both Sunday and Monday at 110 or greater. I work for Portland General Electric and can only imagine how brutal it must have been for our linemen and journeymen repairing outages out in the field. Most utilities saw some heat-related outages due to old equipment & transformers not being able to handle the extreme temperatures combined with the heat generated from extreme system loads.
I’ve always said that you can’t place climate change as the sole cause for any single event, and that goes for the 2021 Pacific Northwest heat wave as well. There were a lot of things that made this heat wave such an extraordinary event. However, climate change’s impact cannot be understated here. More frequent, more severe, and longer-lasting heat waves are the most direct manifestation of global warming on individual weather events.
We’ve all heard about the average temperature rises expected due to global warming, but there seems to be less focus on statistics regarding the predicted magnitude/frequency of heat waves. If we imagine a typical temperature distribution over a region to be a normal Gaussian distribution (i.e. “bell curve”), a small shift towards warmer temperatures has a huge impact on extremes.

Credit: Alex Djuricich, New England Journal of Medicine
In addition to an average temperature increase, climate change will also increase weather patterns and will alter the temperature distribution. How it will alter it is less certain, but there are some studies that indicate the jet stream will become more “wavy,” which would naturally lend to more extreme waves/arctic outbreaks due to stronger and more frequent periods of ridging/troughing. If this was to occur, the distribution above would flatten, making these “tail events” more likely. The combination of a flattening (or skewed warmer) and warming distribution is a terrifying combination for severe heatwaves, as well as droughts and wildfires.

Credit: John McDonald. Retrieved from LibreTexts.
This historically unprecedented heat wave, and the specter of it potentially a once-or-twice a decade event by the second half of this century after we’ve warmed an additional 2C, is truly frightening. There is still a lot of uncertainty in all these predictions, but we’d be foolish to cast away the most dire, scientifically-sound ones as impossible. We’re entering uncharted territory here.
On a lighter note, WeatherTogether was mentioned this morning in The Atlantic! I was interviewed by The Atlantic earlier this week to get my thoughts on the advent of two weather streaming services – one by Fox and another by The Weather Channel. With severe weather having a bigger and bigger impact on people’s lives and climate change a dramatically elevated focus in just the past couple years, there’s a growing market for weather information and these two companies are trying to fill that void. You can read the full article here.
Featured image: Temperature anomalies over North America on 6/27/2021 as measured from GEOS-5 satellite. Credit: NASA/Joshua Davis


