
Saturday, November 7, 2015
2:13 pm

Less than a week ago, Cyclone Chapala slammed into Socotra, a small Yemeni Island some 150 miles east of the Horn of Africa, and Yemen, a small country on the southwestern tip of the Arabian Peninsula currently embroiled in a brutal civil war, becoming the first hurricane-force cyclone to hit Socotra since 1922 and the only hurricane-force cyclone to hit Yemen in their 124-year record. Chapala was the strongest cyclone ever recorded in the Gulf of Aden, and, with 130 mph sustained winds and a 940 hPa central pressure, the second-strongest cyclone ever recorded in the entire Arabian Sea. That’s equivalent to a category 4 hurricane!

While singular events like this are very impressive, it’s even more impressive when a similar thing happens less than a week later. Right after Chapala wreaked havoc on Yemen, Cyclone Megh formed. Megh followed an extremely similar path to Chapala, first striking Socotra and then weakening as it headed towards Yemen and encountered dry air coming off the Arabian Peninsula. Although not as deep as Chapala, it was still equivalent to a category 3 hurricane. It directly hit Socotra near peak strength and ravaged the small Yemeni island with sustained winds of 127 mph. Even though it made landfall in Yemen, it encountered dry air from the Arabian Peninsula as it did so and weakened substantially, sparing Yemen of further damage.

Take a look at a graphic that Stu Ostro of The Weather Channel tweeted. The storms look strikingly similar, and are in a very similar region.

The paths have been very similar too, as illustrated by a graphic showing the tracks and strengths of cyclones in the North Indian basin this year. You can clearly see Chapala heading straight into Yemen, and Megh is the “unfinished” track just to the south of Chalapa and nearly paralleling it, making a direct hit on Socotra and later making landfall in Yemen.
When you compare these paths to the paths of cyclones in the North Indian Ocean from 1970-2005, it’s easy to see that these tracks were pretty abnormal. No systems struck Yemen in that time period. Suddenly, we have two landfalls in one week!

Chalapa was the stronger of the two cyclones, and it was able to keep its general structure before making landfall in Yemen, delivering heavy rain to the area. In fact, some coastal regions got as much as 24 inches of rain in two days… which is equivalent to 7 years’ worth of rainfall for them! In fact, take a look at the two satellite pictures below of Yemen before and after the storm. The difference is startling!


However, Megh wasn’t so lucky, as the entrainment of hot, dry air from the Arabian Desert into the cyclone made the storm all but evaporate. The satellite picture below is hilariously choppy, but it still shows how the dry, continental air utterly destroyed Megh. Still, when you think about how dry that air is, it is very impressive that any storm could even approach the region, much less one of hurricane strength, as was the case with Chapala. Megh landed as a tropical storm.
Why did all of this happen? Why had Yemen never recorded a tropical cyclone and then suddenly get two in one week? Why did Socotra get pounded by two major storms in a week when the last hurricane strength cyclones were in 1922 and 1885 and were only equivalent to a category 1 hurricane?
My first thought was that this might have something to do with El Niño. After all, that’s all we’ve really been talking about for the past six months. It turns out that El Niño does have something to do with it, but it’s not the sole reason. There are other factors at play, including some that had never even crossed my mind. I ended up digging pretty deep into the scientific literature on the subject, and came to some interesting conclusions. If you don’t like science, I’d suggest you turn back now.
First, I discovered that the Arabian Sea is experiencing record-high sea-surface temperatures.

Much of this has to do with a lack of upwelling off the Somali Coast. Upwelling is the process by which deep, cool, nutrient-rich water rises to the surface, so a lack of upwelling means that the water in that area will be warmer. Most zones of upwelling are on the eastern boundaries of ocean basins, including the upwelling that occurs right off our coast in the Northeast Pacific and the upwelling off the coast of Peru in the Eastern Tropical Pacific. The upwelling off the Somali Coast is unique in that it is on a western boundary of an ocean basin. But why does this lack of upwelling occur in the first place?
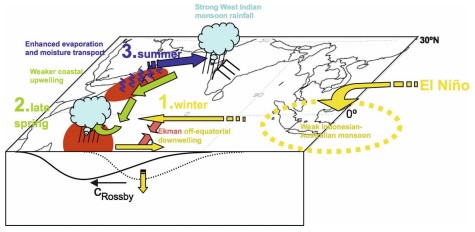
According to Izuma et al.’s “Role of the Somalia-Oman upwelling and ENSO on Indian monsoon rainfall variability,” there are two reasons for the initial existence of warm water: (1) El Niño and/or (2) a weak Indonesian-Australian monsoon from the previous winter. These two phenomena often go hand-in-hand. This is because El Niños often weaken the Indonesian-Australian monsoon by creating anomalously high pressure in the western Pacific and dry conditions over Indonesia, causing devastating forest fires in regions that practice slash & burn agriculture. When one/both of these events occur, they change the pattern of winds in the South Indian Ocean, and these changes can cause downwelling, or the sinking of water from the surface to depth. As a result, you get a large mass of warmer-than-normal water that slowly propagates westward from the Central Indian Ocean to the Southwest Indian Ocean off the eastern coast of Africa.
This mass of water propagates as a Rossby Wave, which is a very long wave driven by wind stress. Rossby waves can be hundreds of kilometers long, but only a few meters tall at the thermocline, tapering to a few centimeters at the ocean surface. These particular Rossby waves take 4-5 months to travel to the eastern coast of Africa, but Rossby waves can take years to cross a large ocean basin such as the Pacific! Rossby waves are very prevalent in the atmosphere as well, but that is for a different blog.
Anyway, this warm water causes a temporary increase in precipitation in the Southwest Indian Ocean. This increase in precipitation leads to weaker northeasterly winds over the Arabian Sea, and because these winds are weaker and less water is being pushed away from the Arabian Coast, less upwelling occurs, and water temperatures are warmer. Izuma et al. found that this actually corresponded with a stronger monsoon for the west coast of India (particularly the Western Ghats, a large mountain range adjacent to the Arabian Sea) due to increased evaporation and moisture transport from the Arabian Sea due to the warmer sea-surface temperatures there.
These findings went against the prevailing idea is that once the water in the Arabian Sea is warmer; the temperature difference between the hot Indian subcontinent and warm Arabian Sea is less, leading to a weaker monsoon, which in turn further reduces upwelling. This shows that there is still a lot of uncertainty in how El Niños affect the Indian monsoon. On the other hand, Izuma et al.’s findings about decreased upwelling off the Somali Coast were consistent with most scientific literature and, more importantly, observations, so there appears to be more certainty on that front at this point.
The decrease in upwelling off the Somali Coast causes enhanced sea surface temperatures in that location, but it turns of that sea surface temperatures have been steadily increasing across the entire Indian Ocean basin over the past decade. Lee et al. (2015) found that ocean heat content between the surface and 700 meters has increased substantially in the Indian Ocean from 2003 to 2012. They hypothesized that the increased frequency of La Niñas during that period created anomalously high sea-surface-heights over the warm waters of the western tropical Pacific, and that some of this warm water traveled to the Indian Ocean through passages between islands in Indonesia in an attempt to reduce the difference in high sea surface heights in the Western Tropical Pacific and low sea surface heights in the Indian Ocean.
Take a look at the change in heat content of the upper 700 meters of the Indian Ocean over time (the “observation” line). Notice how it stays relatively constant with some variability (including a big drop in the mid-late 90s), but that after 2003, it dramatically increases.

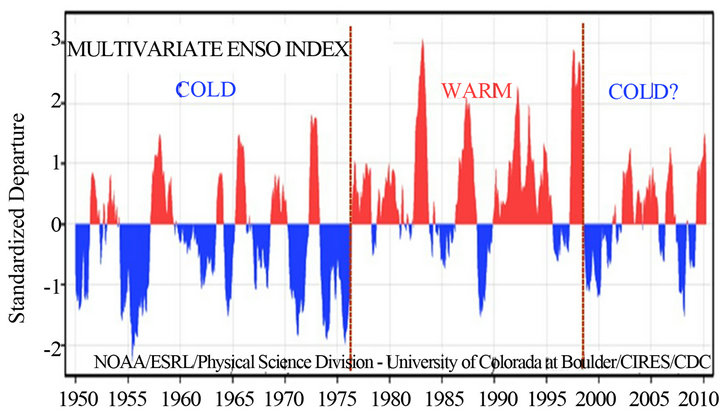
Compare this chart to the “multivariate ENSO index” below, which is an index used to measure the strength of an El Niño or La Niña. As the chart shows, the year-to-year El Niño/La Niña oscillations are superimposed on longer-scale warm and cold oscillations lasting several decades. The heat content in the Indian Ocean started rising from its minimum value around 1997 or 1998 (the year of the largest El Niño on record), and the unofficial “cold” cycle (as marked by the graphic below) began that year as well. Coincidence? Probably not.
But if heat content is rising now, why didn’t heat content rise back in the “cold” phase before 1975?
The answer to this question is likely global warming, and the massive heat intake by the ocean over the past few decades. Even though atmospheric temperatures have risen dramatically since 1970, only 2.3% of heat added due to fossil fuel emissions actually ends up in the atmosphere. 93.4 percent of it ends up in the ocean, with most of it residing in the upper 700 meters. To put it more bluntly, the ocean has absorbed 40 times more heat than the atmosphere, and considering how fast the atmosphere has warmed up, that’s saying something. The ocean will be much slower to respond because of the much higher heat capacity of water, but still, the amount of heat they have absorbed is staggering. Since 1990, the oceans have absorbed more than 2 x 10²³ joules of energy. That’s equivalent to five Hiroshima-sized bombs every second.
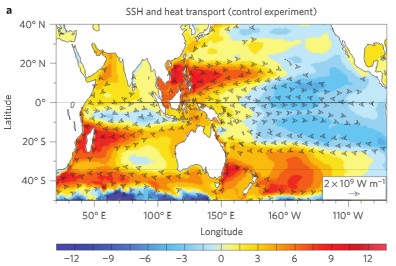
Lee et al.’s model above shows how there are higher than normal sea surface heights in the Western Tropical Pacific, and the arrows show how this warm water flows through channels between the Indonesian islands and works its way into the Indian Ocean. This, added with decreased upwelling, is why the Arabian Sea is experiencing such high temperatures.
But it takes more than just a warm ocean to create a tropical cyclone.

Dry air is a hurricane’s kryptonite. However, even though air around the Saudi Peninsula and Gulf of Amen is very dry, it is still moister than usual, assisting hurricane formation. This may be related to what was discussed in Izuma et al.’s paper – warm ocean temperatures and decreased upwelling correspond with increased evaporation and surface moisture transport to India – but it is more directly attributable to the current state of the Madden-Julian Oscillation (again, that’s for another blog).
Additionally, we are currently in between the summer monsoon season (the wet southwesterly monsoon from the ocean to the land) and the winter monsoon season (the dry northeasterly monsoon from the land to the ocean). Due to this, wind shear is lower, making cyclone formation conditions more favorable. Although this happens every year, the existence of record-breaking sea surface temperatures and a moister than normal atmosphere made conditions more favorable than usual for tropical cyclone formation.
As for why the cyclones took such a similar track into a place that hardly ever experiences any tropical activity, your guess is as good as mine. Thankfully, there are some very smart scientists on the case, and I’m sure we will learn more in the coming months! But I hoped you still enjoyed my detective work. These posts are fun, albeit very time consuming!
On a more local note, there is a threat of major flooding on Western Washington rivers over the weekend. I’ll have a blog on that tomorrow!
Charlie 🙂
Sources:
5.2.2.3 Implications for Earth’s Heat Balance. (2007). Retrieved November 10, 2015, from http://www.ipcc.ch/publications_and_data/ar4/wg1/en/ch5s5-2-2-3.html
Breslin, S. (2015, November 3). Cyclone Chapala Hammers Yemen; At Least 3 Dead – wunderground.com. Retrieved November 10, 2015, from http://www.wunderground.com/news/cyclone-chapala-socotra-yemen
Birchard, G. (2015, October 30). 155 mph Cyclone Chapala, 2nd strongest ever in Arabian sea, Unprecedented Threat to Yemen. Retrieved November 10, 2015, from http://www.dailykos.com/story/2015/10/30/1442751/-155-mph-Cyclone-Chapala-2nd-strongest-ever-in-Arabian-sea-Unprecedented-Threat-to-Yemen
Cyclone Megh Makes Direct Hit on Socotra; Second Final Landfall In Yemen (RECAP). (2015, November 9). Retrieved November 9, 2015, from http://www.weather.com/storms/hurricane/news/cyclone-megh-five-yemen-socotra-somalia-arabian-peninsula
Izumo, T., Montégut, C., Luo, J., Behera, S., Masson, S., & Yamagata, T. (2008). The Role of the Western Arabian Sea Upwelling in Indian Monsoon Rainfall Variability. Journal of Climate, 5603-5623. doi:10.1175/2008JCLI2158.1
Katz, C. (2015, March 30). How Long Can Oceans Continue To Absorb Earth’s Excess Heat? Retrieved November 10, 2015, from http://e360.yale.edu/feature/how_long_can_oceans_continue_to_absorb_earths_excess_heat/2860/
Lee, S., Park, W., Baringer, M., Gordon, A., Huber, B., & Liu, Y. (2015). Pacific origin of the abrupt increase in Indian Ocean heat content during the warming hiatus. Nature Geoscience, 8, 445-449. doi:10.1038/ngeo2438
Masters, J., & Henson, B. (2015, October 30). 2nd Strongest Storm in Arabian Sea History: Extraordinary Chapala Hits 155 mph. Retrieved November 9, 2015, from http://www.wunderground.com/blog/JeffMasters/2nd-strongest-storm-in-arabian-sea-history-extraordinary-chapala-hits
Molion, L., & Lucio, P. (2013). A Note on Pacific Decadal Oscillation, El Nino Southern Oscillation, Atlantic Multidecadal Oscillation and the Intertropical Front in Sahel, Africa. Atmospheric and Climate Sciences,3(3), 269-274. doi:10.4236/acs.2013.33028
Nilfanion (2006, August 16). Cumulative track map of all North Indian ocean cyclones from 1970 to 2005. Retrieved November 10, 2015, from https://en.wikipedia.org/wiki/North_Indian_Ocean_tropical_cyclone#/media/File:North_Indian_cyclone_tracks.jpg
Rice, D. (2015, November 8). Second deadly cyclone in a week targets Yemen. Retrieved November 10, 2015, from http://www.wtsp.com/story/news/2015/11/08/second-deadly-cyclone-week-targets-yemen/75417200/
Shepherd, M. (2015, November 6). Again? Why Is The Arabian Sea Suddenly Getting These Cyclones? Retrieved November 10, 2015, from http://www.forbes.com/sites/marshallshepherd/2015/11/06/again-why-is-the-arabian-sea-suddenly-getting-these-cyclones/
Tropical Cyclone Megh: 12/05/2015 – 12/10/2015 (sic). (2015). Retrieved November 10, 2015, from http://www.wunderground.com/hurricane/northern-arabian/2015/Tropical-Cyclone-Megh?map=sat&MR=1
