
When I was younger, my parents would get me the “Old Farmers Almanac” every year for Christmas. In a time before I knew about dynamical climate models and ensemble-based, bias-corrected seasonal forecasting, the Old Farmer’s Almanac seasonal forecasts were a godsend.

Part of the allure of the Almanac for an upstart weather zealot like myself was the granularity of its seasonal forecasts. For example, here’s what the Almanac is calling for the Pacific Northwest this autumn. If you buy the Almanac, you can get these forecasts out to December 2021!
People like to knock the @almanac for its primitive weather forecasts, but they sure are off to a good start this autumn for the Pacific Northwest! Plus, your Euro weeklies don’t give you gardening tips. #orwx #wawx pic.twitter.com/uBxaLIDyNs
— Charlie Phillips (@GeoduckChuck) September 2, 2020
When I was younger, I mentally bookmarked the Almanac’s forecasts of wind, rain, and snow and hoped they would come true, but they never seemed to come to fruition. This isn’t any surprise to people with a few more years under their belt… how are weathermen supposed to forecast the weather several months in advance if they can’t get the next few days right?
In his seminal 1969 paper, Edward Norton Lorenz, a mathematician and meteorologist who is regarded as the father of chaos theory, postulated that the chaotic nature of the atmosphere made it impossible to forecast the day-to-day weather more than two weeks in advance. 50 years later, a paper by Zhang et. al (2019) concluded that there indeed was a theoretical maximum of 14-15 days for accurate day-to-day weather forecasting, and that in order to reach that level, we’d need to reduce the current-day initial-condition uncertainty by an order of magnitude. This is possible but would take an enormous, coordinated effort to design better models, improve/increase current observations, and improve current data assimilation and computing techniques.

The shading indicates the difference between skill in the northern and southern hemispheres. Forecasts in the southern hemisphere used to be consistently worse than those in the northern hemisphere due to fewer observations, but this huge gap has disappeared in recent years with the advent of satellite observations.
Credit: Zhang et. al (2019)
So even if next year’s Almanac claims they’ve kept up with the 21st century and are using deep learning and artificial intelligence to make their forecasts, they should still be treated for entertainment purposes only.
Seasonal forecasting is a bit different. Instead of predicting the weather on a certain day, we focus on predicting the probability of temperature, rainfall, snowfall, etc. being above or below average for a given time period. Unfortunately, most seasonal weather forecasts have very little skill. A quick glance at the temperature and precipitation forecasts for even the month-ahead outlooks from the Climate Prediction Center show that precipitation forecasts have essentially zero skill. Temperature forecasts are a little better, though much of the skill can be attributed to global warming.


Credit: Climate Prediction Center
However, there are two features in particular that can provide some reasonable guidance into the weather expected over the next several months: an El Nino/La Nina in the tropical Pacific, and a “Blob” of warm water in the Northeast Pacific. El Nino and La Nina have well-documented effects on global atmospheric circulation and affect the location and strength of storms that impact the West Coast in the winter. The Blob is a result of persistent ridging over the Northeast Pacific and has only gained widespread recognition since a particularly strong Blob occurred in 2014-2015, and I’m not aware of any research that has been done on its effects on global atmospheric circulation. But at a more local scale, the Blob increases temperatures for the West Coast by warming and moistening the air that passes over it. The 2014-2015 winter was the warmest on record for many spots in the Pacific NW due to an extraordinarily strong Blob just off the coast, and the 2019 summer saw much warmer-than-average overnight lows due the onshore flow from the Pacific passing over the Blob and picking up more water vapor in the process, as water vapor is a strong greenhouse gas and prevents heat from escaping at night.
Taking a look at the sea-surface temperature anomalies in mid-August, you can see a MASSIVE Blob in the Northeast Pacific and a developing La Nina in the Tropical Pacific. The strongest parts of the Blob had sea-surface-temperature anomalies exceeding 5oC (8oF). These “Blobs” are accompanied by decreased nutrients/primary productivity, and this resulted in disastrous consequences for marine life back in 2014-2015 when the Blob came much closer to the West Coast.

Credit: NOAA
Thankfully, the current sea-surface-temperature anomalies show that the Blob has weakened due to storms over the North Pacific mixing the surface. Also, note how La Nina conditions have strengthened in the tropical Pacific.

Credit: NOAA
La Nina
La Nina is the “cool phase” of El Niño–Southern Oscillation (ENSO), which is the name given to the cycle of the semi-periodic warming and cooling of the tropical eastern Pacific. There are three stages to the entire oscillation: El Niño, La Niña, and “Neutral,” in which the tropical eastern Pacific is neither in an El Niño or La Niña state. Both El Nino and La Nina events generally become apparent in spring or summer, peak around Christmas, occur every 3-5 years, and last for 9-12 months, though they can last as long as 1-3 years.
Closely related to the fluctuations in oceanic temperatures are large-scale changes in atmospheric pressure and resulting differences in trade wind patterns. During Neutral events, the air pressure in the western tropical Pacific is lower than the air pressure in the eastern tropical Pacific, causing the trade winds to blow from east to west.
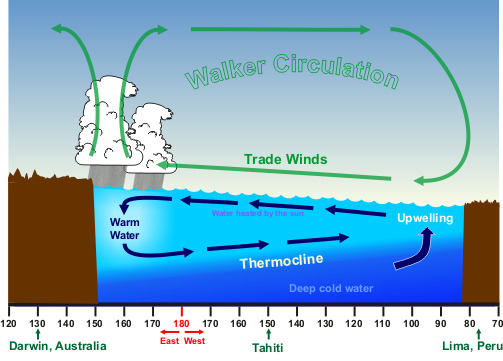
In La Niña events, the normally lower pressure over the western tropical Pacific gets lower, and the normally higher pressure over the eastern tropical Pacific gets higher, which results in a strengthening of the trade winds. The trade winds are essential to the whole ENSO cycle, and they are the driving force behind the differences in water temperature in the eastern tropical Pacific during different respective events.

Weather Impacts:
El Nino and La Nina have dramatic effects on global weather patterns by doing two primary things. First, they are associated with a relative weakening/strengthening of the trade winds, which in turn affects precipitation and atmospheric temperatures in the tropics and subtropics, particularly in the Central and Western Pacific. Additionally, by altering the temperatures in the tropical Pacific, they increase the equator-to-pole temperature gradient during an El Nino and decrease it during a La Nina.
The impacts of El Nino and La Nina over North America are most pronounced during the winter, especially after January 1. Neutral winters tend to be highly variable for the Pacific Northwest, with alternating periods of strong, zonal flow off the Pacific, arctic outbreaks from Canada, and persistent blocking patterns in the Eastern Pacific that bring us warmer and drier-than-average weather.

La Nina and El Nino years tend to have less variability than Neutral years and have characteristic weather patterns that often arise. During El Ninos, the jet stream tends to be stronger and further south than average, bringing flooding rains to Califonia and heavy snow to the Sierra Nevada/Intermountain West but warmer and calmer-than-average conditions to the Pacific Northwest. During La Ninas, a ridge of high pressure often forms in the Northern Pacific, and the Pacific Northwest sees persistent northwesterly flow, bringing cooler and slightly wetter-than-average winters with well-above-average mountain snowfall.

Credit: NWS
La Nina Forecast:
The Climate Prediction Center currently has a “La Nina Advisory” and forecasts a 70-80% chance of La Nina conditions persisting to December-February 2020-21, with a ~50% chance of continuing through February-April 2021.

The averages of the models predict La Niña to continue through the Northern Hemisphere winter 2020-21.

This La Nina is expected to stay relatively weak compared to historical La Ninas. If we take a look at precipitation & temperature anomalies during other weak La Nina events, we can see that there is a clear tendency for the Pacific Northwest to be cooler and wetter-than-average.

Credit: NOAA Physical Sciences Laboratory

Credit: NOAA Physical Sciences Laboratory
Combining La Nina and long-term temperature increases due to global warming, we get the following seasonal (November-December-January) forecast from the Climate Prediction Center for the Pacific Northwest; a slight chance of above-average precipitation and equal chances of temperatures being above, below, or near average. California looks to stay drier and warmer than average… not good for their drought situation.


This would be good for snow in the mountains. It’s impossible to know if we’ll see snow in the lowlands this year, so don’t even ask!
As for the Old Farmer’s Almanac?

Wet? You Bet!
– Charlie
1 Comment
Charlie, I don’t really pay much attention to long range forecasts as they rarely seem to be accurate here in Michigan. Last winter was predicted to be brutal for us, and it was just the opposite. This year, they are giving us mixed opinions. Maybe that’s the smartest and safest way to go. Have a great day.