
La Ninas typically feature cool and wet springs, and the 2021-2022 La Nina has had that in spades. According to Chief Fox12 Meteorologist Mark Nelsen, Portland just experienced its wettest April on record, the coolest April since 2011, and, as denizens of the Portland metropolitan area know all too well, had a very rare April snowstorm on April 10th. Interestingly, the 2020-2021 winter also featured a La Nina, and April 2021 was the driest April in Portland’s history, causing snowpack to rapidly collapse and causing a rapid expansion of drought conditions that worsened over the summer. It is a textbook example of the variance and uncertainty inherent in long-range forecasting.
This blog is rather long and is divided into two sections. The first section explains the basics behind La Nina (and its brother, El Nino) and explains how La Nina conditions in the Tropical Pacific give increased chances of cooler and wetter-than-average conditions over the Pacific Northwest. The second section explains how the La Nina conditions have played out this spring, gives an overview of our cool/wet pattern and snowpack recovery over the last month, and gives a longer-range outlook for June, with some thoughts on the positive impacts our cool/wet weather has had regarding fire danger and water supply/river levels. At the very end, I’ve summarized the main points of the entire blog.
Part 1: El Nino/La Nina Basics
With the exception of a mega-blob of warm water in the Northeast Pacific like the one from 2014-2015 (read my “Blob” blog to learn more), the state of the Tropical Pacific is the single biggest determinant of our winter and spring weather in the Pacific Northwest. La Ninas and El Ninos are “coupled” oceanic and atmospheric phenomena – meaning that changes in the sea-surface temperatures over the Tropical Pacific impact the atmosphere, and vise versa. It would seem to be a “chicken and egg” problem, and indeed, scientists aren’t quite sure of how it starts, but they do know some of the typical impacts it has on weather all over the globe.
Atmospheric Circulation, Sea-Surface Temperatures, and the Walker Circulation
To understand ENSO (“El Nino Southern Oscillation” – the broad term given to the entire El Nino/Neutral/La Nina phenomenon), we have to understand the relationship between global wind patterns and global sea-surface temperature distribution. In the subtropics, trade winds arrive from the northeast in the Northern Hemisphere and southeast in the Southern Hemisphere, and this pushes the warmest water to the western portions of ocean basins.

Right image: Retrieved from Climate Prediction Center
This phenomenon is most pronounced in the Pacific basin, where it is known as the Walker Circulation. With the “typical” Walker Circulation, trade winds push the warmest water and highest thunderstorm activity towards the Maritime Continent while causing strong upwelling and atmospheric subsidence/drier conditions off the coast of Peru.

Picture credit: Wikimedia User PAR
As the image below shows, El Ninos weaken or partially reverse the Walker Circulation, resulting in weaker upwelling off the Peruvian coast and drier conditions over the Maritime continent, while La Ninas strengthen it.

Picture credit: NOAA, retrieved from stratusdeck.co.uk
ENSO Impacts: Tropics
El Ninos in particular can have disastrous impacts for both sides of the Pacific. The 1997-1998 El Nino caused devastating forest fires in Indonesia that scorched nearly 20 million acres of land when the autumn and winter rainy season failed to arrive, and El Ninos have repeatedly resulted in poor anchovy fisheries off of Ecuador and Peru, where fishing is a significant contributor to the local economy (Peru typically lands 5-7 million tons of anchovies per year and recorded nearly 3.5 billion dollars of fishing exports in 2019).
During strong La Nina years, it is not uncommon for sea-surface-temperatures to differ by as much as 20 degrees F between the Peruvian Coast and the Western Pacific. In addition, the sea level over the Western Pacific can rise up to 20cm above-average during strong La Nina events due to the the stronger winds piling up water further west. For the many low-lying islands in the Western Pacific, the combination of significantly higher-than-average sea levels due to periodic La Nina episodes, accelerating sea-level rise due to global warming, and increasingly powerful typhoons due to global warming, represents an existential threat to permanent settlement as global warming and sea-level rise progress.
ENSO Impacts: Midlatitudes
ENSO’s impacts in the midlatitudes stem from how the Walker Circulation over the Tropical Pacific influences the position of the West Pacific jet stream. During a strong La Nina, where the Walker Circulation is stronger-than-normal, the West Pacific jet is “pushed” west by the stronger trade winds. With the jet stream retracted west, a blocking ridge of high pressure forms in the North Pacific. This ridge tends to prevent major storms from reaching California, but downstream troughing on the eastern side of this ridge often keeps the Pacific Northwest cooler and wetter-than-average, with California and the Desert Southwest occasionally seeing wet/chilly periods if the trough digs deep enough south. During a strong El Nino, where the Walker circulation is weaker-than-normal or reversed, the Western Pacific Jet moves east, resulting in lower pressure over the North Pacific and a much clearer storm track across the Pacific into California. Due to the rarity of northwesterly flow during El Nino winters, the Pacific Northwest tends to experience above-average temperatures and below-average mountain snowfall.

Image created using NOAA’s Interactive Climate Analysis Plotting Tool
Part 2: The 2021-2022 La Nina and Our Record Cold Spring
The 2021-2022 La Nina was not as strong as the 2020-2021 La Nina during its winter peak, but unlike nearly all La Ninas (including the 2020-2021 La Nina), it has maintained its strength well into the spring. In fact, the latest La Nina update released by the Climate Prediction Center shows that SSTs over the Tropical Pacific are now at their lowest point of the entire 2021-2022 La Nina.

Credit: Climate Prediction Center
The current SST image from NOAA shows a moderate La Nina event in the Tropical Pacific and a swath of cooler-than-average SST along the West Coast. Both of these have contributed to the cool weather we’ve seen this spring, and both increase the odds of cooler-than-average temperatures continuing for the Pacific Northwest through June.

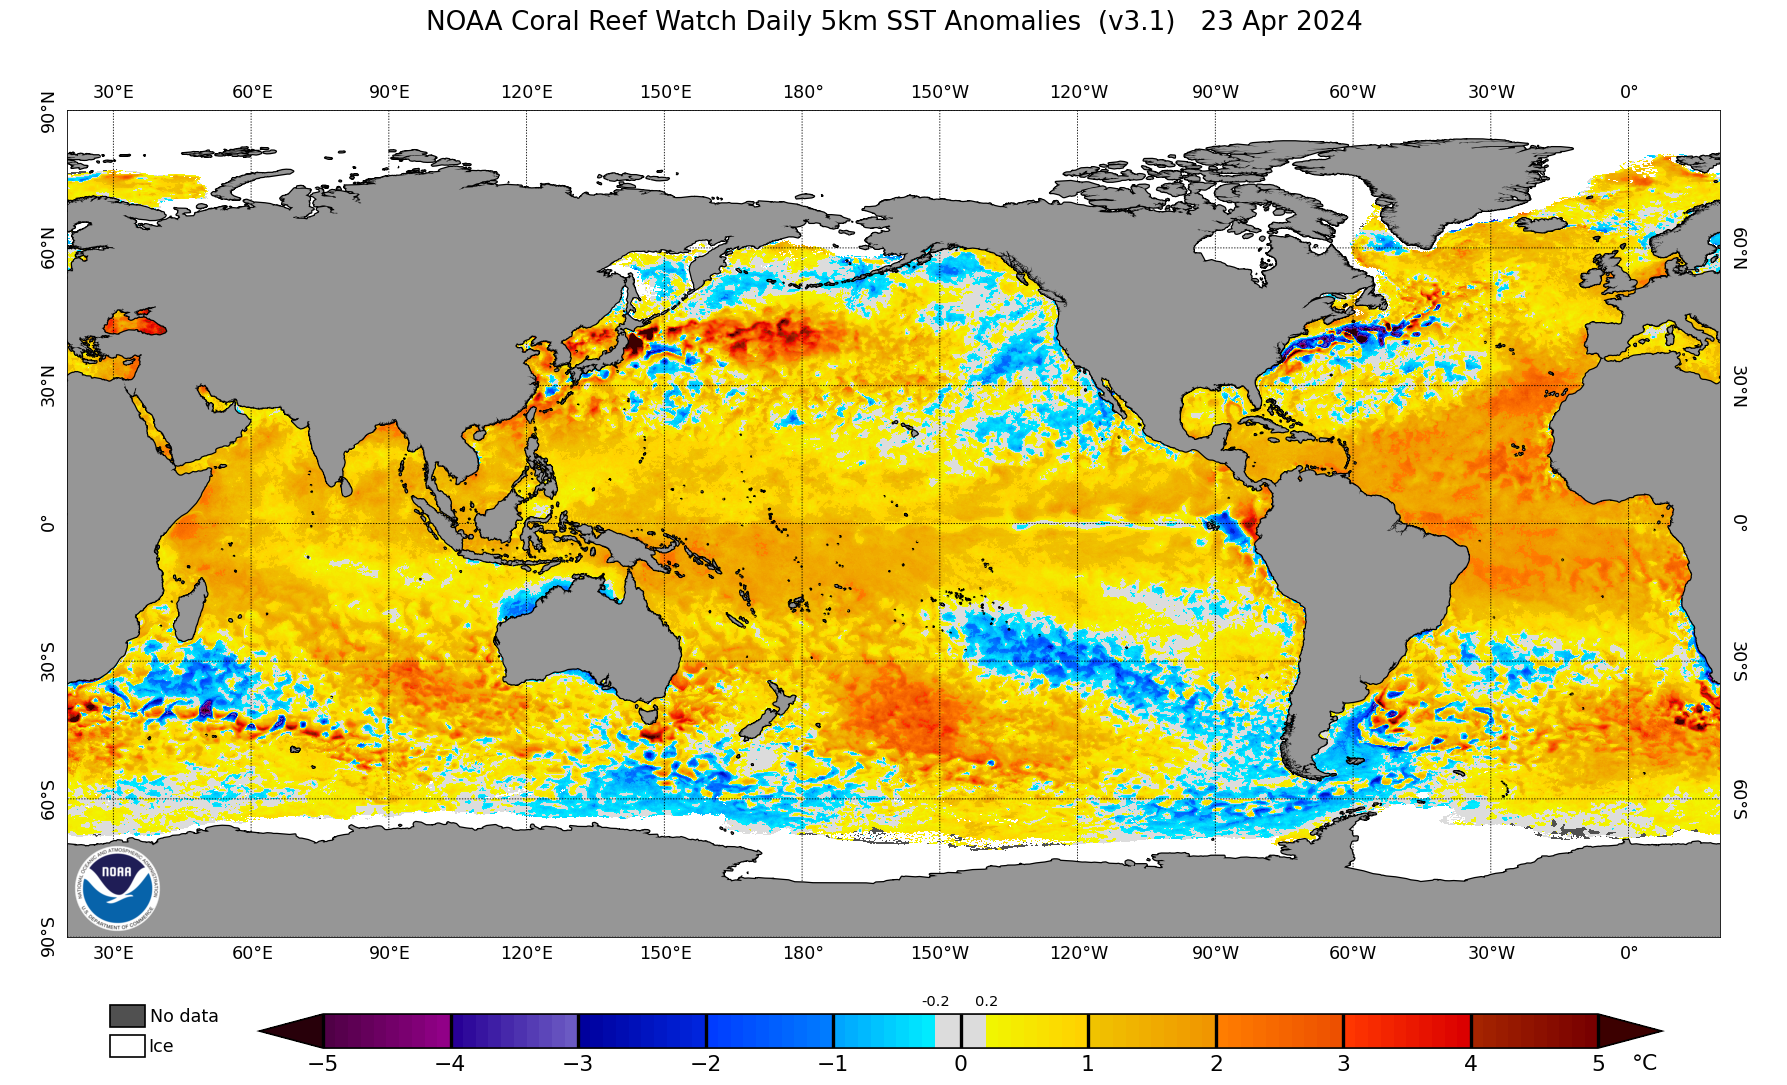
Upper Level Patterns
During March, the upper-level pattern over the Northern Pacific had a large ridge of high pressure over the Pacific NW, giving us warmer-than-average temps and below-average precipitation. It was not a typical La Nina pattern – and just goes to show how La Ninas only “weigh the dice” towards a certain pattern (and often don’t weigh them too heavily).

Image created using NOAA’s Interactive Climate Analysis Plotting Tool
But look at the pattern from April 1 onward! What a turnaround. This is your more “typical” La Nina pattern, with a blocking ridge preventing California and the Desert SW from seeing major storms. Meanwhile, the Pacific Northwest has experienced anomalous troughing and cool, moist northwesterly flow downstream of this ridge.

Image created using NOAA’s Interactive Climate Analysis Plotting Tool
Temperature and Precipitation Anomalies
Since April 1, the Pacific Northwest has been much wetter than average, and the northern half of the Western US has been cooler-than-average. Southern California and the Desert Southwest have been drier and warmer-than-average due to the persistent ridging there.

Credit: Western Regional Climate Center

Credit: Western Regional Climate Center
Snowpack
With a cool and wet April/beginning of May after a relatively calm March, mountain snowpack has grown at most locations over the past month, even at sites where it is typically declining by this time of year. Mt. Hood is a great example – snowpack there is now at its highest level of the entire year. Snowpack at that site typically peaks on April 25, and last year it peaked on April 11! Note how the gain in snowpack from April 1 – current has been larger than the gain from January 8 through March 31… this winter honestly wasn’t that impressive for snow in the Cascades. But spring has sure delivered the goods!

As the image below shows, snowpack is above-average for nearly all of the Pacific Northwest. Higher snowpack helps delay the start of fire season; in spring 2021, the Oregon Department of Forestry declared its earliest start to the fire season in 40 years (May 15, to be exact) due to the record-dry spring and rapidly declining snowpack. This snowpack is particularly helpful considering that much of Eastern & Southern Oregon – and parts of Eastern Washington – are still experiencing extreme drought conditions. This higher-than-average snowpack will also increase summer/autumn river flows and will hopefully increase salmon survival rates when they return up the rivers to spawn.

On the snowpack front, I will add that I was a little irked that the Summit at Snoqualmie didn’t keep Alpental open for Cinco de Mayo this year – their last day was May 1. Cinco de Mayo (conditions permitting) is an Alpental tradition, and as the webcam below shows, Alpental has more than enough snow to keep the slopes open. Thankfully, some diehard skiers were having none of it and decided to hike up the slope themselves. And yes, it did snow up there today.

Forecast
The Climate Prediction Center is expecting La Nina to persist through the summer, with a 50-55% chance of La Nina persisting into next autumn. Given that we are now in mid-May and still have a substantial La Nina event in the Tropical Pacific, I have pretty high confidence that La Nina will indeed persist this summer (albeit with a weakening trend) and I wouldn’t be surprised if the Climate Prediction Center increases their La Nina chances for autumn with their next forecast update.
Both the ECMWF (shown) and GEFS show cooler-than-average temperatures persisting through the remainder of May into June. Given the combination of La Nina conditions and cooler-than-average sea-surface-temperatures off our coast, I think this is a pretty good forecast. So yes, a “Juneuary” may be in the cards for us. The ECMWF is actually forecasting drier-than-average conditions for the Pacific Northwest during this time, but long-term precipitation forecasts are typically poorer than temperature forecasts & I don’t have a strong opinion either way regarding precipitation.

Credit: Weatherbell.com
Summary:
Here are the main takeaways from the blog.
- The impacts of El Nino and La Nina on weather over the Pacific Northwest stem from how changes in the strength of the Walker Circulation impact the location and strength of the West Pacific Jet.
- The 2021-2022 La Nina was not as strong as the 2020-2021 La Nina during its winter peak, but unlike the 2020-2021 La Nina, it has maintained its strength well into the spring.
- La Nina conditions are expected to persist through the summer, albeit likely with somewhat of a weakening trend.
- Spring 2022 has had dramatically different weather than Spring 2021, despite both being La Nina years. For instance, April 2021 was Portland’s driest April on record, while April 2022 was Portland’s wettest on record.
- June is expected to feature continued below-average temperatures and delayed snowmelt/high-elevation snowbuild for the Pacific Northwest, with less confidence in precipitation. Combined with pre-existing moist soils and above-average snowpack throughout the Pacific Northwest, this suggests a delayed start to fire season and higher river flows this summer and autumn (good for salmon, farmers, hydroelectricity, reservoir levels, etc.)
- Most importantly, the Summit at Snoqualmie should keep Alpental open for Cinco de Mayo when possible! Who knows how many skiable Cinco de Mayos are left in Alpental’s future? Not many, at the rate we are going…
Charlie