Monday, October 24, 2011
11:46 P.M.

The graphic above shows the temperatures and precipitation predicted each day out to 16 days in the future by the GFS (Global Forecast System) model. I recently installed several programs from http://www.brianschmit.com/ and this was one of them. I’ve talked to Brian and he has given me permission to use his programs and post the pictures. His website is incredible, I’d highly suggest checking it out. Additionally, you can go to the “Downloads” tab on the right and download some of his programs. They are very, very helpful and informative. Thank you so much Brian!
It is interesting to look at these long term forecasts, but they are generally only good for seeing trends, and sometimes they are too inconsistent to even see that. The NWS generally makes daily forecasts out to seven days, and uses the rest of the GFS model input to look for trends. Lately, the GFS has indicated very cool temperatures for the beginning of November along with several wet systems coming through. The precipitation has varied wildly from run to run, but the bottom line is this: we will likely see significant snowfall in the mountains starting the first week of November.
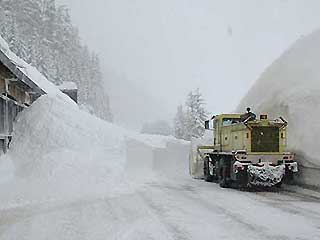
By the way, that above picture is from late January of 2008, when the pass was closed for super heavy snow. We won’t be seeing any weather quite like that right yet, but the pass should get pretty snowy, and if this La Nina pans out as expected, we should have a pretty snowy winter in general.
Before we get cold, we will see highs in the mid 50s this week with periods of light rain starting Friday and continuing until at least Monday as a series of decaying fronts sweep through. Nothing to write home about. But after that? Hold on to your hats.
November is coming.


