Thursday, October 31, 2013
10:00 p.m.
We’ve already gone through a couple of variables representing the amount of water vapor in the air. These are e, the partial pressure of water vapor, and T_v, the virtual temperautre, which is equal to 1/ε*T.
There are some we haven’t gone over though, so I’ll go over them now.
3.) Mixing ratio
The mixing ratio is equal to the grams of water vapor over the kilograms of dry air. It is conserved if there is no condensation or evaporation.
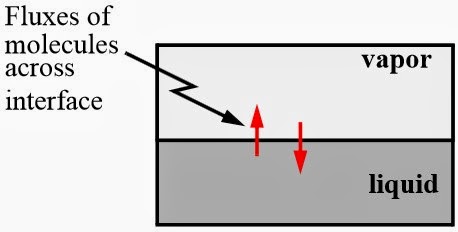
4.) Saturation vapor pressure
The saturation vapor pressure e_s is the vapor pressure when the gas is in equilibrium with a plane surface of liquid water. In other words, it is when the fluxes of molecules across the liquid into the vapor and vise-versa are equal.
The saturation vapor pressure, like the amount of water vapor that air can hold, increases exponentially with increasing temperature.
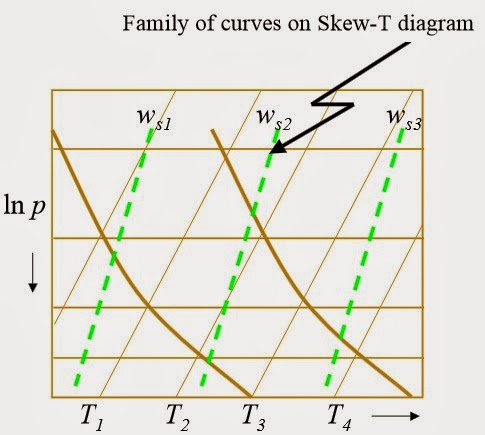
5.) Saturation Mixing Ratio

The saturation mixing ratio is the same thing as the mixing ratio except it assumes the given air parcel to be saturated. On the skew-t plot below, they are given by the green dashed lines. The skewed straight lines going to the right are lines of constant temperature, while the horizontal lines are lines of constant pressure. The thicker, slightly curved lines are dry adiabats. I know that I said earlier that air cools at a rate of 9.8 degrees K per km. It turns out that it’s not quite a linear relationship.
6.) Relative Humidity
Relative humidity is equal to the mixing ratio divided by the saturation mixing ratio. Say, for example, that the mixing ratio is 3 and the saturation mixing ratio is 6. Then, the relative humidity is 50%.
7.) Dew point
The dew point is the temperature at which the air would have 100% relative humidity. In other words, the dew point is the intersection of the temperature and the saturation mixing ratio on a skew t chart.

8.) LCL (Lifting Condensation Level)

The LCL is the level to which an unsaturated parcel of air can be lifted dry adiabatically before it becomes saturated (with respect to a plane surface of pure water).
When the air is lifted, the mixing ratio w and the potential temperature θ remain constant, but the saturation mixing ratio w_s decreases until it is equal to w. This is because air cools with height when it is risen adiabatically. Therefore, the mixing ratio and the saturation mixing ratio have to meet at some point, and the LCL is that point.
After saturation, the air can no longer hold any more water, so as it cools and it can hold less and less, more and more has to be condensed out. w_s and w decrease at the same rate when a parcel is saturated and cools. Also, latent heat is released, so the change in thermal energy is NOT equal to 0. This leads us to…
9.) Moist Adiabatic Lapse Rate
This is a big one, so listen closely. The dry adiabatic lapse rate is nearly constant. The moist one is not; it varies with temperature and pressure. As I stated above, latent heat is released when water vapor condenses, so it makes sense that this lapse rate would be less than the dry adiabatic lapse rate. It ranges from around 4 degrees C/km in warm, humid environments at the surface to 7 degrees C/km in the middle troposphere.
So if latent heat is released, why do we still call this an adiabatic process? Well, sometimes, the air parcel which rose and had the water vapor condensed out of it can fall without any of the water droplets escaping, requiring them to form back into vapor so the parcel can become dry again. In that case, the process is completely adiabatic. Otherwise, you are indeed exchanging heat energy, and we call the process pseudoadiabatic.
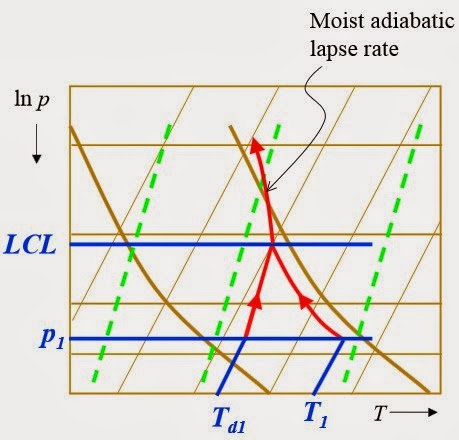
The picture below shows the temperature, saturated mixing ratio, dry adiabat, and moist adiabat lines on a skew t with temperature on the x-axis and pressure on the y-axis.

10.) Level of Free Convection (LFC)
The level of free convection of the atmosphere is the altitude above which the temperature of the environment decreases faster than the moist adiabatic lapse rate of a saturated air parcel at the same altitude. It is a function of the amount of moisture in the rising parcel of air and the environmental lapse rate.
In the picture below, the LFC is found by finding the LCL of the air and then raising the air moist adiabatically until it reaches the same temperature as the environment. After it reaches this level, the air is free to rise because it has a lapse rate that is lower than the environmental lapse rate. This leads to convective clouds (ex: cumulus and cumulonimbus… NOT stratus)

The picture above shows a sounding in a conditionally unstable environment, which means the environmental lapse rate, or how much the air changes with height in the atmosphere, is between the dry and moist adiabatic lapse rates. The slope of the environment temperature sounding (T) has a steeper slope than the dry adiabat but a more gradual one than the moist adiabat. Keep in mind, however, that the temperature decreases with height/pressure more with the dry adiabat… we just have temperature on the x axis. The parcel (red) lifted from the surface (p1) changes its temperature T at the dry adiabatic lapse rate of 9.8 degrees C/km parallel to the dry adiabats and keeps its dewpoint T_d parallel to the saturation mixing ratio lines until the LCL. The parcel then changes both T and T_d to the moist adiabats.
It is colder than the environment below the LFC and warmer (and therefore buoyant) above.
I’m not Walt Whitman, nor do I aim to be. This is, first and foremost, a study guide. Still, if you’re not studying meteorology, you could study this with the aim of conversation topics for first dates.
“Hmm.. nice day today… what do you think the LFC is?”
Charlie


1 Comment
Very useful page for analysing Skew T Log P diagram. thanks charlie!!