Saturday, October 17, 2015
4:01 pm
 |
| Beach erosion by Pacifica, California due to storms during the 1997-1998 El Niño event. Credit: USGS |
With all of this talk about the “Godzilla” El Niño of 2015, it’s important to remember that an event of this magnitude is not unprecedented. Back during the 1997-1998 winter, we saw the largest El Niño on record, and while the jury is out on whether this El Niño will surpass that one in strength, the effects from this El Niño on weather worldwide are expected to resemble those from the 1997-1998 El Niño. El Niño is not the only factor that decides the fate of our winter, but it is definitely the largest one. Heck, this El Niño was responsible for the destruction of our beloved Blob of warm water off our coast that helped give us 19 straight months of above-normal temperatures.
Therefore, it makes sense to take a look back at the 1997-1998 El Niño and see how the two events have compared thus far. We have weather models to predict our precipitation and temperature anomalies, but climate models do not predict specific events. By looking at the specific events that occurred with the 1997-1998 El Niño, we can get an even better idea of what to expect this coming winter.
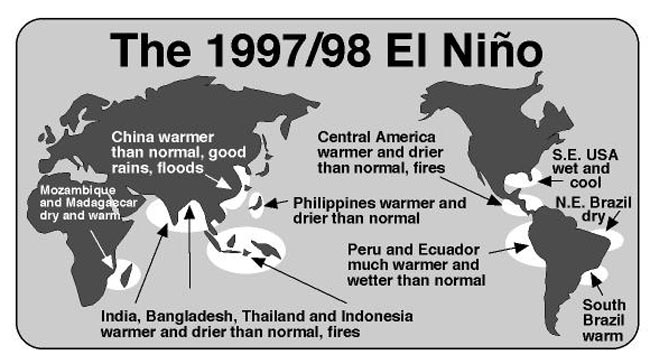 |
| Credit: Shrimp News |
As this graphic shows, El Niño is truly a global phenomenon. One of the first effects of the 1997-1998 El Niño was a series of devastating wildfires in Indonesia in the summer of 1997. Many Indonesian farmers use slash-and-burn agriculture to create fields, but because Indonesia is so wet, catastrophic forest fires typically do not occur, as the moist soil, summertime downpours, and green vegetation help slow or stop the spread of these fires. However, during El Niño years, convection that typically takes place over Indonesia shifts to the east over the central tropical Pacific, leaving Indonesia much drier and much more prone to these fires. The 1997 Indonesia fires were some of the largest, if not the largest, wildfires in recorded history.
 |
| A fire in East Kalimantan province in Borneo, an island of Indonesia. Credit: Global Fire Monitoring Center. |
Not surprisingly, 2015 has been a bad year for fires in Indonesia as well. While it has been much better than 1997, nearly 100,000 fires have been detected as of October 15 thus far, more than any other year since at least 2003 (likely 1997, but we did not have satellite fire detection then).
 |
| Credit: Global Fire Data |
We are on pace to have the worst fire season here since 1997, but as you can see, 1997 was much, much worse. The fires have released over one gigaton of Carbon Dioxide into the atmosphere so far this year, and the season is far from over. That’s two BILLION pounds. Think about that. Still, over 8 billion pounds of carbon dioxide were released in 1997, which is more carbon dioxide than the entire European Union emits in a year. Basically, the fires are bad this year, but they are nowhere near as bad as 1997. Thank goodness.
 |
| Credit: Global Fire Data |
Strong El Niños are also commonly associated with active Pacific hurricane/typhoon seasons due to above-average water temperatures in the tropical Pacific and reduced wind shear. The 1997 Pacific typhoon season (Western Pacific basin) was the most active on record with a record 10 category 5 supertyphoons, and the 2015 Pacific hurricane season (Northeast/Central Pacific basins) has been extremely active as well, with record activity in the Central Pacific. 23 tropical storms have formed thus far, and I have a feeling we will surpass the record of 27 storms set in 1992, also an El Niño year. During late August, there were three major hurricanes occurring simultaneously in the Pacific east of the International Date Line, something that had never occurred in history. It was very impressive, and reminded me of a similar trifecta of storms that was depicted in the extremely realistic climate thriller “The Day After Tomorrow.” Meanwhile, El Niños actually tend to decrease the amount/strength of cyclones in the Atlantic due to increased wind shear, and this year has been no exception.
 |
| From left to right, major hurricanes Kilo, Ignacio, and Jimena. Satellite picture taken August 30, 2015. Credit: NASA Earth Observatory |
 |
| A storm simulation from The Day After Tomorrow. These storms would kill trillions of people and lead to the next ice age. Credit:Climate Change Dispatch |
I could go on and on talking about the worldwide effects of the 1997-1998 El Niño. It temporarily warmed the Earth by 1.5 degrees and was responsible for the death of 16% of the world’s coral reefs. Although individual places have weather extremes every year, no year in the 20th century was as abnormal worldwide as the 1997-1998 El Niño.
Over the United States, the 1997-1998 El Niño featured wet conditions in the southern states and warm conditions in the northern states, something that is consistent with an active southern branch of the jet stream and a northern branch acting to keep arctic air locked up in central Canada. This is a very typical El Niño pattern, and as a rule of thumb, the stronger the El Niño is, the more probable it is that this pattern will occur. January and February 1998 were the warmest and wettest months ever recorded for the United States, with December 1997 being slightly colder and drier than these two months (but still warmer and wetter than average).
In December 1997, warm and dry conditions dominated the northern half of the country, particularly the northern plains states and the Midwest, as the northern branch of the jet stream prevented arctic air from intruding southward into the U.S. Meanwhile, the southern branch of the jet stream was responsible for cooler-than-average weather in the southeast, with record rainfall in parts of Florida and near-record rains throughout much of the southeast. The Southwest was wet as well, but the effects were not record-breaking (California would go on to have record rains in February). Interestingly enough, the central-southern portions Great Plains and Midwest received above-normal snowfall, as they were cold enough to pick up snow but still had the benefit of the active southern storm track to give them above-normal precipitation.
January 1998 was similar to December 1997 throughout most of the country. Precipitation records were broken throughout the Gulf States, with New Orleans racking up a record 19.28 inches that month. Temperatures in the northern plains, Great Basin, Ohio Valley, and Mid-Atlantic were as high as 10 degrees F above normal for the month in some regions. The Pacific Northwest actually saw above-normal precipitation that month, which is somewhat unusual for an El Niño winter but definitely not unheard of. The Pacific Northwest generally receives near or slightly below normal precipitation in El Niño years. Sea-Tac received 7.15 inches of rain compared to its average of 5.63, and Snoqualmie Pass picked up 149 inches of snow, way above its average of 103.8 for the month.
 |
| A powerful, early February 1998 storm that caused flooding throughout California. Credit: NOAA |
February was very similar to January and December for much of the nation, with warm conditions to the north and cool temperatures with record rainfall to the south. For example, the average temperature of 29.1 degrees F at Sault Ste. Marie, MI was 15.1 degrees above normal, setting a new record for the warmest February ever. Lake Erie remained unfrozen for only the third winter in history… the last two being 1952-1953 and 1982-1983. Both of these years were El Niño years, and the 1982-1983 El Niño was the second-strongest ever recorded, just being a smidge weaker than the 1997-1998 El Niño. Although the southeast was still wet, California was now making headlines and breaking records as storm after storm pummeled it, causing flooding, mudslides, and substantial beach erosion. Santa Barbara received an incredible 21.74 inches of rain for February alone, setting a new record for the wettest month in recorded history. For comparison, they’ve only accumulated 20.19 inches since 2013. California would benefit from a lot of rain this year, but the biblical rains they saw in February 1998 caused death and destruction. In other words, let’s hope they get really wet, but not really really wet.
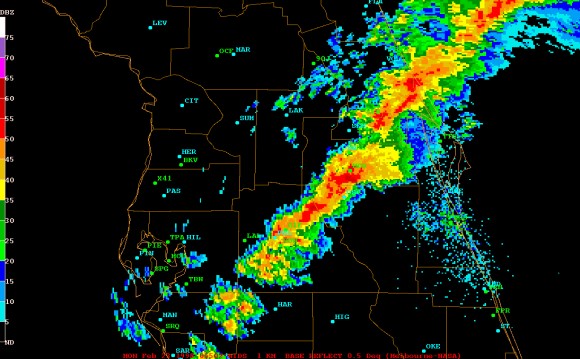 |
| A line of tornadic supercells rolling through Florida at 1:55 am. Credit: NOAA |
Three weeks later and over 3,000 miles away, the deadliest tornado outbreak in Florida State history occurred. While tornadoes can occur any time of the year (especially in Florida), it is unusual to have them in February. Also, the vast majority of tornadoes that occur in Florida are relatively weak, but this outbreak had several tornadoes that were classified as upper-level F3 twisters. These struck between 11:30 pm February 22 and 2:30 am February 23, and because of their unfortunate timing when many people were sleeping and did not have time to escape, this tornado outbreak is colloquially known as the “Night of the Tornadoes” and remains the deadliest outbreak in Florida history.
In conclusion, the 1997-1998 winter (December-February) was super wet with average temperatures to the south and super warm and relatively dry in the north. The map below summarizes the winter quite nicely.
 |
| Credit: NOAA |
In this map, the numbers represent how the precipitation total and average temperature of the state compare to 103 years of historical record, with 1 being the coldest/driest and 103 being the warmest/wettest. The northern Plains states and the Midwest were exceptionally warm, with most states either having their warmest or second-warmest winter ever, and many of them were relatively dry as well. The southern states saw more-or-less average temperatures, but they were slightly below average during rainy periods. They were exceptionally wet, particularly in the southeast during December and January and the southwest during February. Here in the Pacific Northwest, we escaped relatively unscathed, and our snowpack was only slightly below normal.
At first glance, it would seem like we should expect very similar conditions for this winter. Both of these El Niños are similar in strength, and they are the main driver of the climate system. However, there are important differences between this El Niño and the 1997-1998 El Niño. For example, the 1997-1998 El Niño was strongest in the Eastern Pacific, while this El Niño was been strongest in the Central Pacific thus far. Additionally, even if the El Niños were identical, the world is different now than it was in 1997-1998. Other oscillations like the Pacific Decadal Oscillations are in different states now than they were during the last El Niño. The world is warmer now than it was back then, with less arctic sea ice. You get the idea.
Still, we’ve seen fires in Indonesia, a historically active Pacific hurricane season, and catastrophic flooding in the southeast. And this El Niño continues to become stronger. Nobody knows for sure, but preliminary winter forecasts are calling for warm and dry to the north and wet to the south, first the southeast and then California as winter progresses. WeatherOn is releasing an extended winter outlook on November 1st that will cover the entire country, so stay tuned. Spoiler alert: Seattle is going to be colder than last winter.
Thanks for reading!
Charlie