
With a strong atmospheric river underway, I thought I’d take some time to delve a little deeper into these phenomena. In this blog, I’ll cover the basic characteristics of an atmospheric river, how these atmospheric rivers form, and a brief summary of how they relate to the Earth’s heat budget. Throughout the blog, I’ll use two of the largest atmospheric rivers of the past decade – the November 6-7 atmospheric river and the December 2-3 “Great Coastal Gale” (one of my all-time favorite storms) – as examples to show just how powerful these beasts can be.
The Basics of an Atmospheric River
As you may know, atmospheric rivers are long, narrow filaments of moisture that transfer water vapor from the subtropics to the midlatitudes. MIT professors Reginald Newell and Yong Zhu came up with the “atmospheric river” moniker in the early 90s to reflect the extremely long and narrow nature of these filaments, which are on average 2000 km long yet only 300-500 km wide (Gimeno et al., 2014). Some atmospheric rivers can be much, much longer – the atmospheric river that affected us on Wednesday 10/18 stretched an incredible 8,000 km from the coast of China to the Pacific Northwest.

Credit: NASA Worldview
Atmospheric rivers carry a ton of moisture. According to a 1998 paper by our friends Reginald Newell and Yong Zhu, the typical atmospheric river transports approximately 180,000 tons of moisture every second, which is comparable to the flow of 23.5 Columbia Rivers. Given the fact that there are typically four to five atmospheric rivers occurring in each hemisphere at any given time, it’s no surprise that they are responsible for almost all the meridional water vapor transport even though they typically cover less than 10% of the Earth’s surface at any given latitude (Newell and Zhu, 1998). The reason for this is simply because the subtropics, being much warmer than the midlatitudes, can hold far more water vapor.
The fact that warmer air can hold more water vapor than cooler air is extremely important – if there was no difference or if this relationship was reversed, precipitation would be much harder to come by. This is because precipitation is generally created when air is forced to rise, and since the atmosphere typically cools with height, this air eventually cools to the point where water vapor condenses out into liquid cloud droplets. The amount of water vapor air can hold increases exponentially with temperature (see the Clausius Clapeyron equation for more on this relationship), and that’s a big reason why atmospheric rivers are so efficient at transporting water vapor to the midlatitudes.
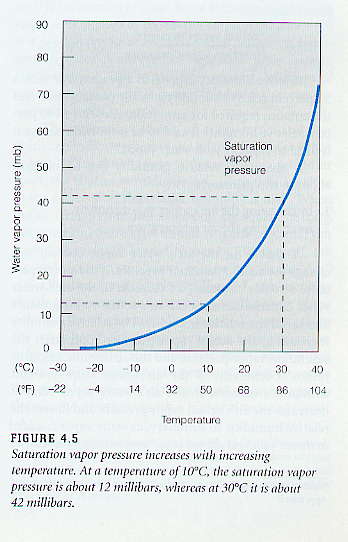
Credit: University of Arizona Atmospheric Sciences Department
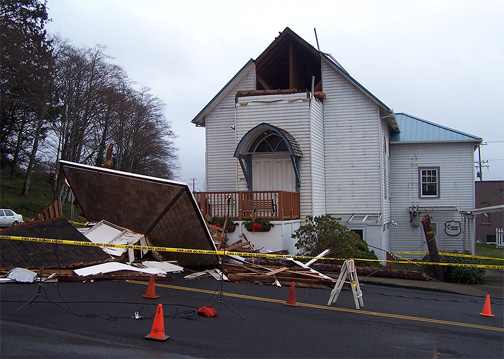
In order to transport so much water vapor, you not only need an ample source of moisture in the subtropics, you need strong winds to transport it to the midlatitudes. Ralph et al. (2005) estimated that 75% of the moisture in an atmospheric river is transported via low-level jet streams below 2.25 km hPa. These low-level jets can often bring a prolonged period of high winds to coastal areas in the Pacific Northwest, and in some cases (such as the December 2007 Great Coastal Gale), these winds can be extreme.
Credit: Michelle Matchet of the Lewis County Sheriff’s Office, originally retrieved from the KOMO News 2006 Weather Year in Review (sadly, no longer online – that was a year for the record books!)
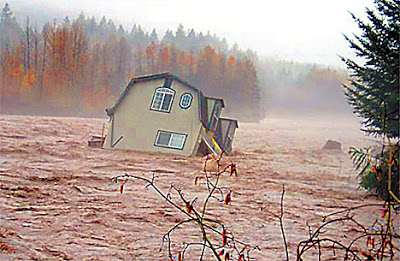
With their warm temperatures aloft, high moisture content, and strong winds, every major river flood event on the west side of the Cascades that I am aware of has been due to a strong atmospheric river. The warm temperatures aloft ensure that precipitation falls as rain nearly everywhere except the volcanoes, and the high moisture content and strong winds aloft work in tandem to ensure that extremely heavy precipitation falls on the windward slopes of terrain. Moreover, these atmospheric rivers will often stall over a certain area, and when they do, the effects can be devastating. Mt. Rainier National Park was hammered during the November 6-7, 2006 atmospheric river and picked up a staggering 18 inches in only 36 hours. This was enough to send the many rivers (including the Cowlitz above) to all-time highs that will not soon be broken.
It’s important to note that not all atmospheric rivers in the Pacific Northwest occur in the winter and bring heavy rain, or even rain at all. You can have an atmospheric river in the summer that gives sunny skies and unusually moist conditions. In fact, the severe thunderstorms that occurred over the Pacific Northwest on Thursday, May 4 were caused by the convergence of an atmospheric river bringing moist, warm air at low levels and an incoming upper-level trough bringing much cooler air at upper-levels.
Now that we’ve covered some basic atmospheric river anatomy, reviewed why they are so efficient at transporting moisture, and covered some of their local effects for us here in the Pacific Northwest, let’s take a look at how they form.
Formation Mechanisms
At the surface, you need a low pressure system with a long, trailing cold front extending into the subtropics that that helps draw moisture northward to the midlatitudes. Additionally, strong winds ahead of the cold front increase water vapor transport, and convergence along the front increases precipitation intensity.

Credit: Ralph et al., 2004
At the upper levels, this is often accomplished by having a large trough to depress the jet stream equatorward where it can tap into some subtropical moisture and then a large ridge to the west to bump the jet stream poleward so it can transport this moisture into the midlatitudes.
Credit: University of Washington Atmospheric Sciences
As one of the most vicious atmospheric rivers on record for the Pacific Northwest, the Great Coastal Gale is a textbook example of the upper-level pattern needed for a major atmospheric river. Note the large trough near 145 degrees west and the ridge over the Intermountain West.
Not only does this orient the jet stream in the correct direction, the temperature contrast between the cool trough and the warm ridge results in an extremely strong horizontal pressure gradient (via the hypsometric equation). In the case of the Great Coastal Gale, sustained 850 hPa wind speeds reached 100 mph over a wide swath of SW Washington/NW Oregon, and surface wind speeds along the coast were nothing short of incredible, with gusts to 94 at Astoria, 125 at Lincoln City, and 140 at Naselle Ridge.
Credit: Wolf Read
An atmospheric river that comes out of the southwest like this is often called a “Pineapple Express,” as the moisture has origins near Hawaii. Again, the Great Coastal Gale is a textbook example of this, with the moisture originating right over the Big Island.
Retrieved using the UW Atmospheric Sciences Online Weather Graphics Archive Tool
We’ll sometimes get atmospheric rivers from a more westerly direction. Because these atmospheric rivers originate from higher latitudes, they typically bring lower snow levels and have lower water vapor content, but they can still be extraordinarily wet and windy systems. Best of all, they can bring copious amounts of snow to the highest passes. Since many of these originate near Japan, UW atmospheric science professor Cliff Mass often calls them a “Sushi Express.”
The Madden-Julian Oscillation (MJO)
The MJO is a 30-60 day oscillation between above-average and below-average tropical rainfall, primarily over the Indian and Pacific Ocean. However, an MJO propogates eastward around the globe and all areas in the tropics are affected by it to some extent. As the diagram below illustrates, the wet phase of an MJO is often a precursor to strong Pineapple Express events in the Pacific Northwest.
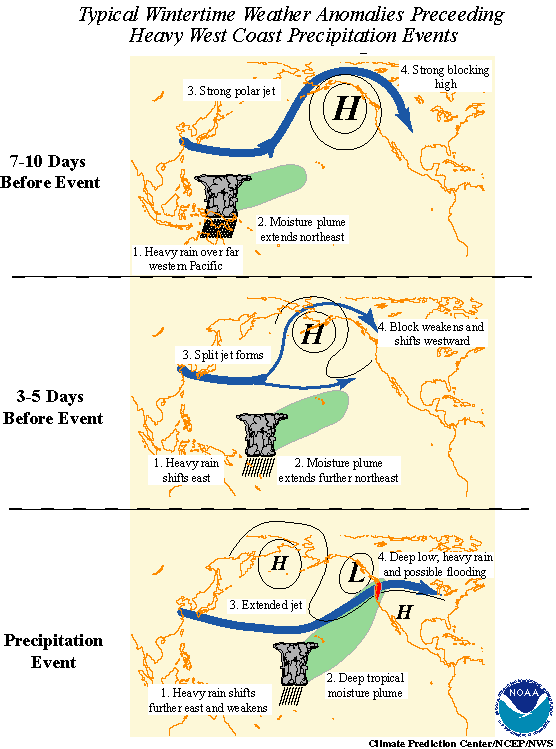
Credit: NOAA/Climate Prediction Center
To summarize: to create an atmospheric river, you need a deep trough and ridge to its west at upper levels to create upper-level southwesterly flow, and you need a surface low with a long trailing cold front to tap into low-level moisture and further enhance water vapor transport by increasing low-level winds ahead of the cold front. Convergence along the cold front can further increase rainfall rates, and a wet MJO propagating across the Pacific is a common (though by no means exclusive… each phase of the MJO lasts 30-60 days and most of our atmospheric rivers do not stem from an MJO) way for strong atmospheric rivers to form.
Atmospheric Rivers and Our Heat Budget
One of the most important things to know in atmospheric science is how the Earth experiences a radiation surplus (solar radiation in is greater than infrared radiation out) at lower latitudes and a radiation deficit at higher latitudes. The exact latitude that divides the surplus and deficit varies widely with the season, but it is approximately 40 degrees on average.
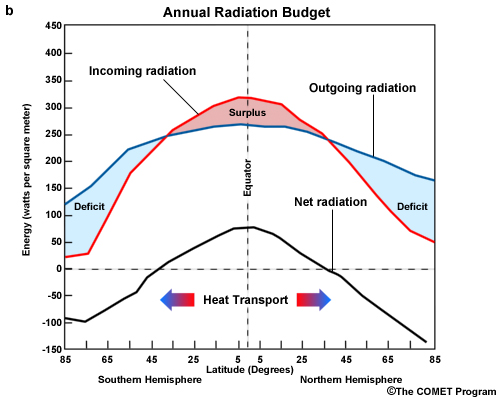
To balance out this deficit and surplus, we need some mechanism (or mechanisms) to transport heat from lower latitudes to higher latitudes. There are two such mechanisms – warm, poleward ocean currents (the Gulf Stream, Kuroshio, and other “western boundary currents” on the western edges of ocean basins are highly effective at this) and atmospheric rivers (Zhang, 2010). Though atmospheric rivers bring mild air temperatures up to the midlatitudes, their primary contribution to the heat budget comes from the latent heat that is released when the water vapor condenses into cloud droplets (Zhang, 2010). Water has a very high latent heat, meaning it releases a lot of energy when it changes phase from gas to liquid (and vise versa).
I hope this review helped you gain some additional insight into atmospheric rivers! As I finish this at 1:09 AM here in northeast Portland, it is raining cats and dogs as the juiciest part of the river is sagging southward into the Portland area. Nothing like the sound of rain to lull you to sleep.
References:
Atmospheric river. (2017, October 01). Retrieved October 21, 2017, from https://en.wikipedia.org/wiki/Atmospheric_river
Crash Course in Cyclogenesis. (n.d.). Retrieved October 21, 2017, from http://www.atmo.arizona.edu/students/courselinks/fall12/atmo336/lectures/sec1/cyclogenesis.html
Dettinger, M. D. (2013). Atmospheric Rivers as Drought Busters on the U.S. West Coast. Journal of Hydrometeorology, 14(6), 1721-1732. doi:10.1175/jhm-d-13-02.1
Dettinger, M. D., Ralph, F. M., Das, T., Neiman, P. J., & Cayan, D. R. (2011). Atmospheric Rivers, Floods and the Water Resources of California. Atmospheric Rivers, Floods and the Water Resources of California,3(2), 445-478. doi:10.3390/w3020445
Gimeno, L., Nieto, R., Vãzquez, M., & Lavers, D. A. (2014). Atmospheric rivers: a mini-review. Frontiers in Earth Science, 2. doi:10.3389/feart.2014.00002
Liange, A., & Evans, J. (2011). Introduction to Tropical Meteorology (2nd ed.). NCAR: The COMET Program.
Lynn, A. (2006, November 7). Lordy: That’s a house floating down the Cowlitz River – Lights & Sirens. Retrieved October 21, 2017, from http://blog.thenewstribune.com/crime/2006/11/07/lordy-thats-a-house-floating-down-the-cowlitz-river/
Mass, C. (2015, October 21). Atmospheric Rivers. Retrieved October 21, 2017, from https://atmos.washington.edu/~cliff/AtmosphericRIvers15r.pdf
Ralph, F. M., Neiman, P. J., & Rotunno, R. (2005). Dropsonde Observations in Low-Level Jets over the Northeastern Pacific Ocean from CALJET-1998 and PACJET-2001: Mean Vertical-Profile and Atmospheric-River Characteristics. Monthly Weather Review, 133(4), 889-910. doi:10.1175/mwr2896.1
Ralph, F. M., Neiman, P. J., & Wick, G. A. (2004). Satellite and CALJET Aircraft Observations of Atmospheric Rivers over the Eastern North Pacific Ocean during the Winter of 1997/98. Monthly Weather Review, 132(7), 1721-1745. doi:10.1175/1520-0493(2004)132<1721:SACAOO>2.0.CO;2
Read, W. (2008, November 23). The Great Coastal Gale of December 1 – 3, 2007. Retrieved October 21, 2017, from http://www.climate.washington.edu/stormking/December2007.html
Tropical Intraseasonal Activity Frequently Asked Questions. (2002, August 29). Retrieved October 21, 2017, from http://www.cpc.ncep.noaa.gov/products/intraseasonal/intraseasonal_faq.html
Zhang, X. (2010, February 21). Retrieved October 21, 2017, from http://www.madsci.org/posts/archives/2010-02/1266860580.Es.r.html
Zhu, Y., & Newell, R. E. (1998). A Proposed Algorithm for Moisture Fluxes from Atmospheric Rivers. A Proposed Algorithm for Moisture Fluxes from Atmospheric Rivers. doi:https://doi.org/10.1175/1520-0493(1998)126<0725:APAFMF>2.0.CO;2

1 Comment